Ronald Leeper: Highlights 2015
Surface Observing Networks
- The new precipitation algorithm for the U.S. Climate Reference Network (USCRN) was deployed this year, wrapping up a multi-year effort to improve the network’s capacity to monitor precipitation at a 5-minute frequency. Currently working with the National Ecological Observatory Network (NEON) to set up an operational version of this algorithm for their precipitation system.
- In a collaborative effort with Scott Stevens of CICS-NC, a preliminary comparison of USCRN precipitation intensities with the Q2 radar analysis has revealed step changes in radar-based precipitation associated with changes in the Z–R relationship. While this was expected at the higher intensity range (moderate to intensity precipitation) to better handle instances of hail, the changeover from stratiform to convective precipitation was also evident.
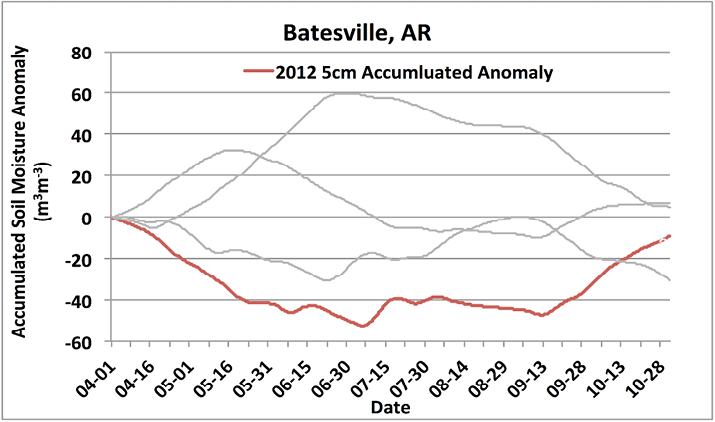
Cumulative 5 cm volumetric soil moisture anomaly at the USCRN Batesville, AK station from 2012 (red) to 2015. Cumulative deficits can be a possible metric to evaluate the timing of drought intensification (April to June at this station) and recovery (after September). The gray lines represent the other years (2013-2015) with 2015 having the higher cumulative values, which coincided with flooding near this station (not shown).
- Analyzed changes to USCRN precipitation patterns over the 2012 drought and compared USCRN soil conditions to a commonly used reanalysis model: the North American Regional Reanalysis. These two studies highlighted the severity of the 2012 drought and the model’s capacity to simulate the evolution of hydrological extremes. In addition, the development of a soil product for the USCRN that can monitor both sides of hydrological extremes (droughts and floods) is currently underway.
Climate Assessments
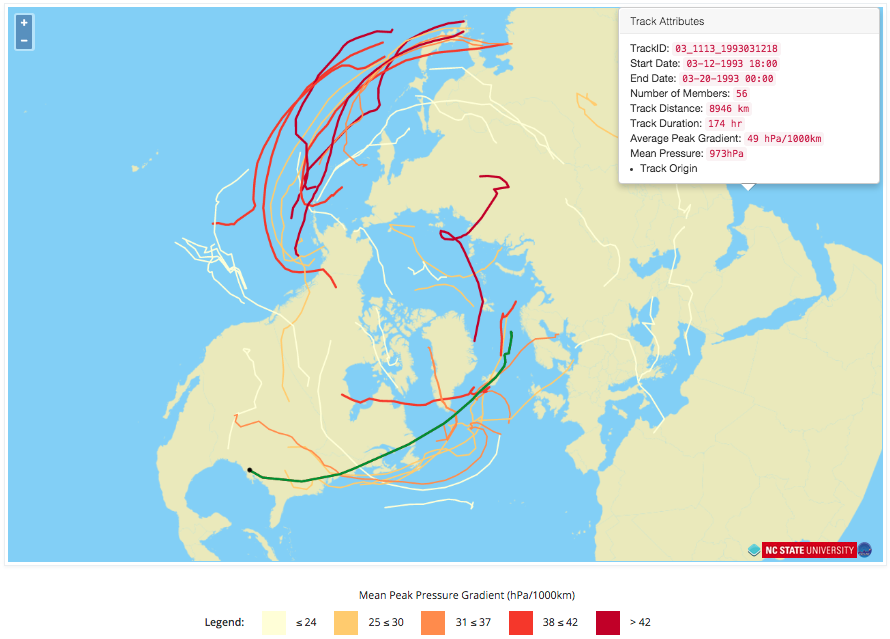
- Developed and deployed an approach to create ensemble average extra-tropical cyclone (ETC) tracks from the 20th Century Reanalysis. This dataset contains tracking information for weather systems outside of the tropics (i.e., Nor’easters, Alberta Clippers, etc.) in much the same way hurricanes are tracked. The track data dates back to the 1870’s and allows further investigations into ETC track patterns (i.e., poleward progress of mid-latitude weather systems, changes in track densities with interannual oscillations, etc.). An interactive website has been set up to allow users to access the dataset (see figure 2): https://etcsrv.cicsnc.org/ETCv8/.
- As a follow-up to the ETC project, an ongoing analysis utilizing this dataset is investigating changes in track density anomalies with Madden Julian Oscillation (MJO) phases. This is a multi-institutional collaboration with folks from CICS-NC (Carl Schreck), Colorado State University, and the University of Tasmania. Preliminary results reveal Nor’easter type tracks have a more positive anomaly (are more frequent) during MJO phases 7–8, which seems to correlate well with significant Northeast snow events based on NCEI’s Regional Snowfall Index (RSI) scores.
2. A snapshot of the ETC-viewer showing ensemble ETC tracks for March 1993 colored by track intensity (member mean peak pressure gradient). A popup of the March-93 super storm (highlighted in green) reveals additional track attributes in the top-right when tracks are clicked-on.