Carl Schreck: Highlights 2015
Reference Environmental Data Records
- Launched an improved version of website for monitoring and prediction of the Madden–Julian Oscillation and other tropical variability: http://monitor.cicsnc.org/mjo/. The website serves ~300 unique users each month.
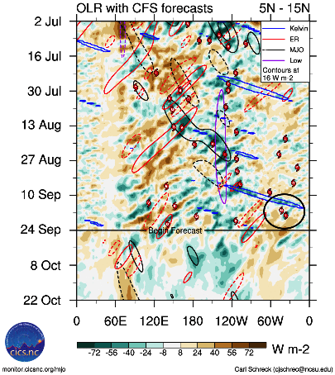
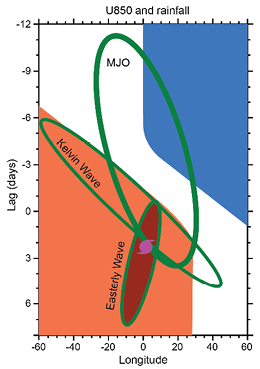
Left: Schematic of the interaction between Kelvin waves, the Madden–Julian Oscillation (MJO), and easterly waves during tropical cyclogenesis. The shading indicates zonal wind at 850 hPa with easterlies in blue and westerlies in red. The contours identify the rainfall associated with each feature. Right: Example time–longitude Hovmöller from http://monitor.cicsnc.org/mjo/ of the outgoing longwave radiation (OLR) climate data record (CDR). The circle highlights a particularly strong Kelvin wave that preceded the formation of tropical depression Nine and tropical storm Ida in the Atlantic.

Other Projects
-
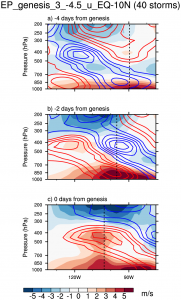
Vertical cross-section composites for eastern Pacific tropical cyclones forming 3.00–3.75 days after Kelvin wave passage. Semi-Lagrangian zonal winds are shaded and Kelvin-filtered zonal winds are contoured.
Lone author of a paper published in Monthly Weather Review describing the effect of Kelvin waves on tropical cyclone activity around the globe (NASA funded). Figure 2 shows vertical composites of Lagrangian zonal wind for eastern Pacific storms that formed 3.00–3.75 days after a Kelvin wave’s peak convection. The equatorial westerlies in Kelvin waves (red contours) are tilted westward with height. Before intersecting the Kelvin wave (Fig. 1a), the easterly wave (vertical dashed line) has only shallow westerlies (red shading). These deepen somewhat as they are reinforced by the Kelvin wave’s low-level westerlies (Fig. 1b). As the Kelvin wave passes, these westerlies deepen due to the Kelvin wave’s tilt. Tropical cyclogenesis happens when these westerlies extend up to 400 hPa (Fig. 1c), which would support a deep cyclonic circulation.
- Provided research support to Riskpulse, Inc. for their development of WindRisk, a statistical model to forecast German wind power. The predictors in this model are the leading EOFs for a variety of atmospheric variables, including NCEI’s daily outgoing longwave radiation (OLR) CDR. These EOFs were calculated using both raw daily data and time-averaged data to leverage intraseasonal-to-interannual climate variability. OLR proved to be a valuable predictor in week 2 and beyond. A sample forecast is shown in Figure 3.

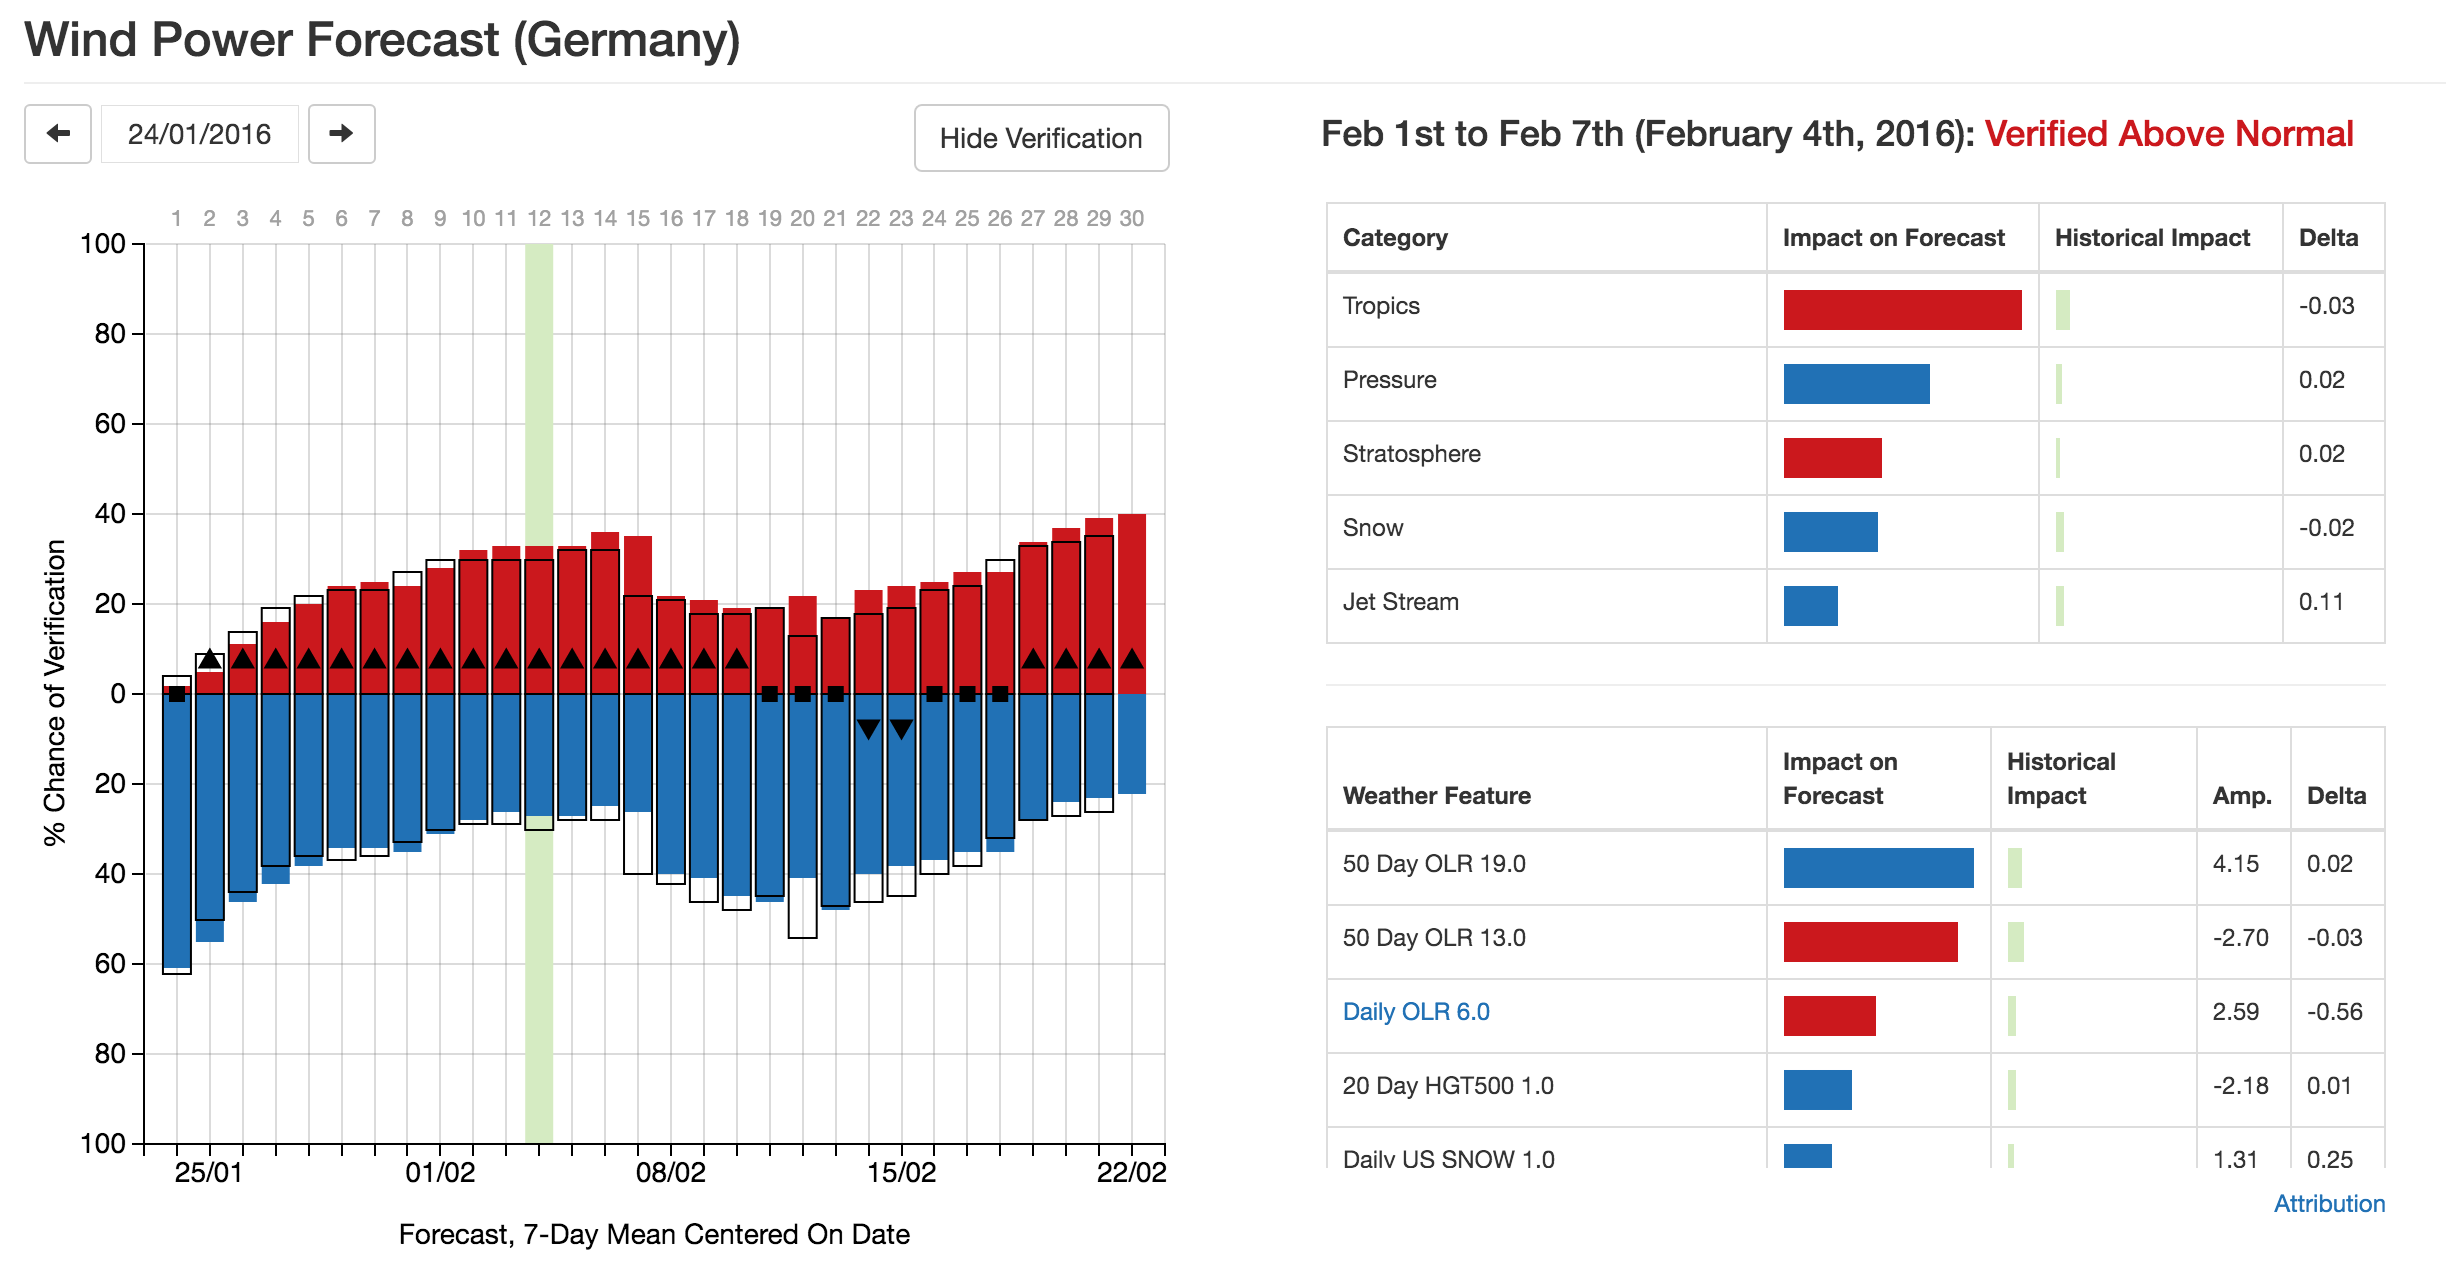
Left: Probability of low (blue) and high (red) wind power for overlapping 7-day windows. Arrows indicate actual verification. Right: Relative contributions of individual predictors and groups of predictors. Red indicates predictors that increase wind power, blue bars suppress it.